In this article:
Overview
VectorFieldRenderableSeries renders a two-dimensional vector field as a collection of arrows. Each arrow represents a vector defined by:
- an origin (X, Y)
- a displacement vector (DX, DY)
The direction of the arrow is determined by (DX, DY), while its visual length may represent the true vector magnitude, a scaled screen-space magnitude, or a constant arrow length.
Vector fields are commonly used to visualize:
- velocity fields (fluid dynamics)
- wind maps
- gradients
- electromagnetic fields
- optical flow
The series supports both uniform grid and scattered data, real-time updates, magnitude or direction-based coloring, LOD rendering for large datasets, and interactive inspection through tooltips.

Vector Field Concepts
Each vector consists of two components:
Origin (X, Y) - the starting point of the vector.
Displacement (DX, DY) - the vector direction and magnitude relative to the origin.
The magnitude of a vector is:
|v| = sqrt (DX² + DY²)
The magnitude can be used to determine arrow length, color, or both depending on configuration.
Data Series Types
Vector fields can be represented using two different data series types depending on how the vectors are arranged.
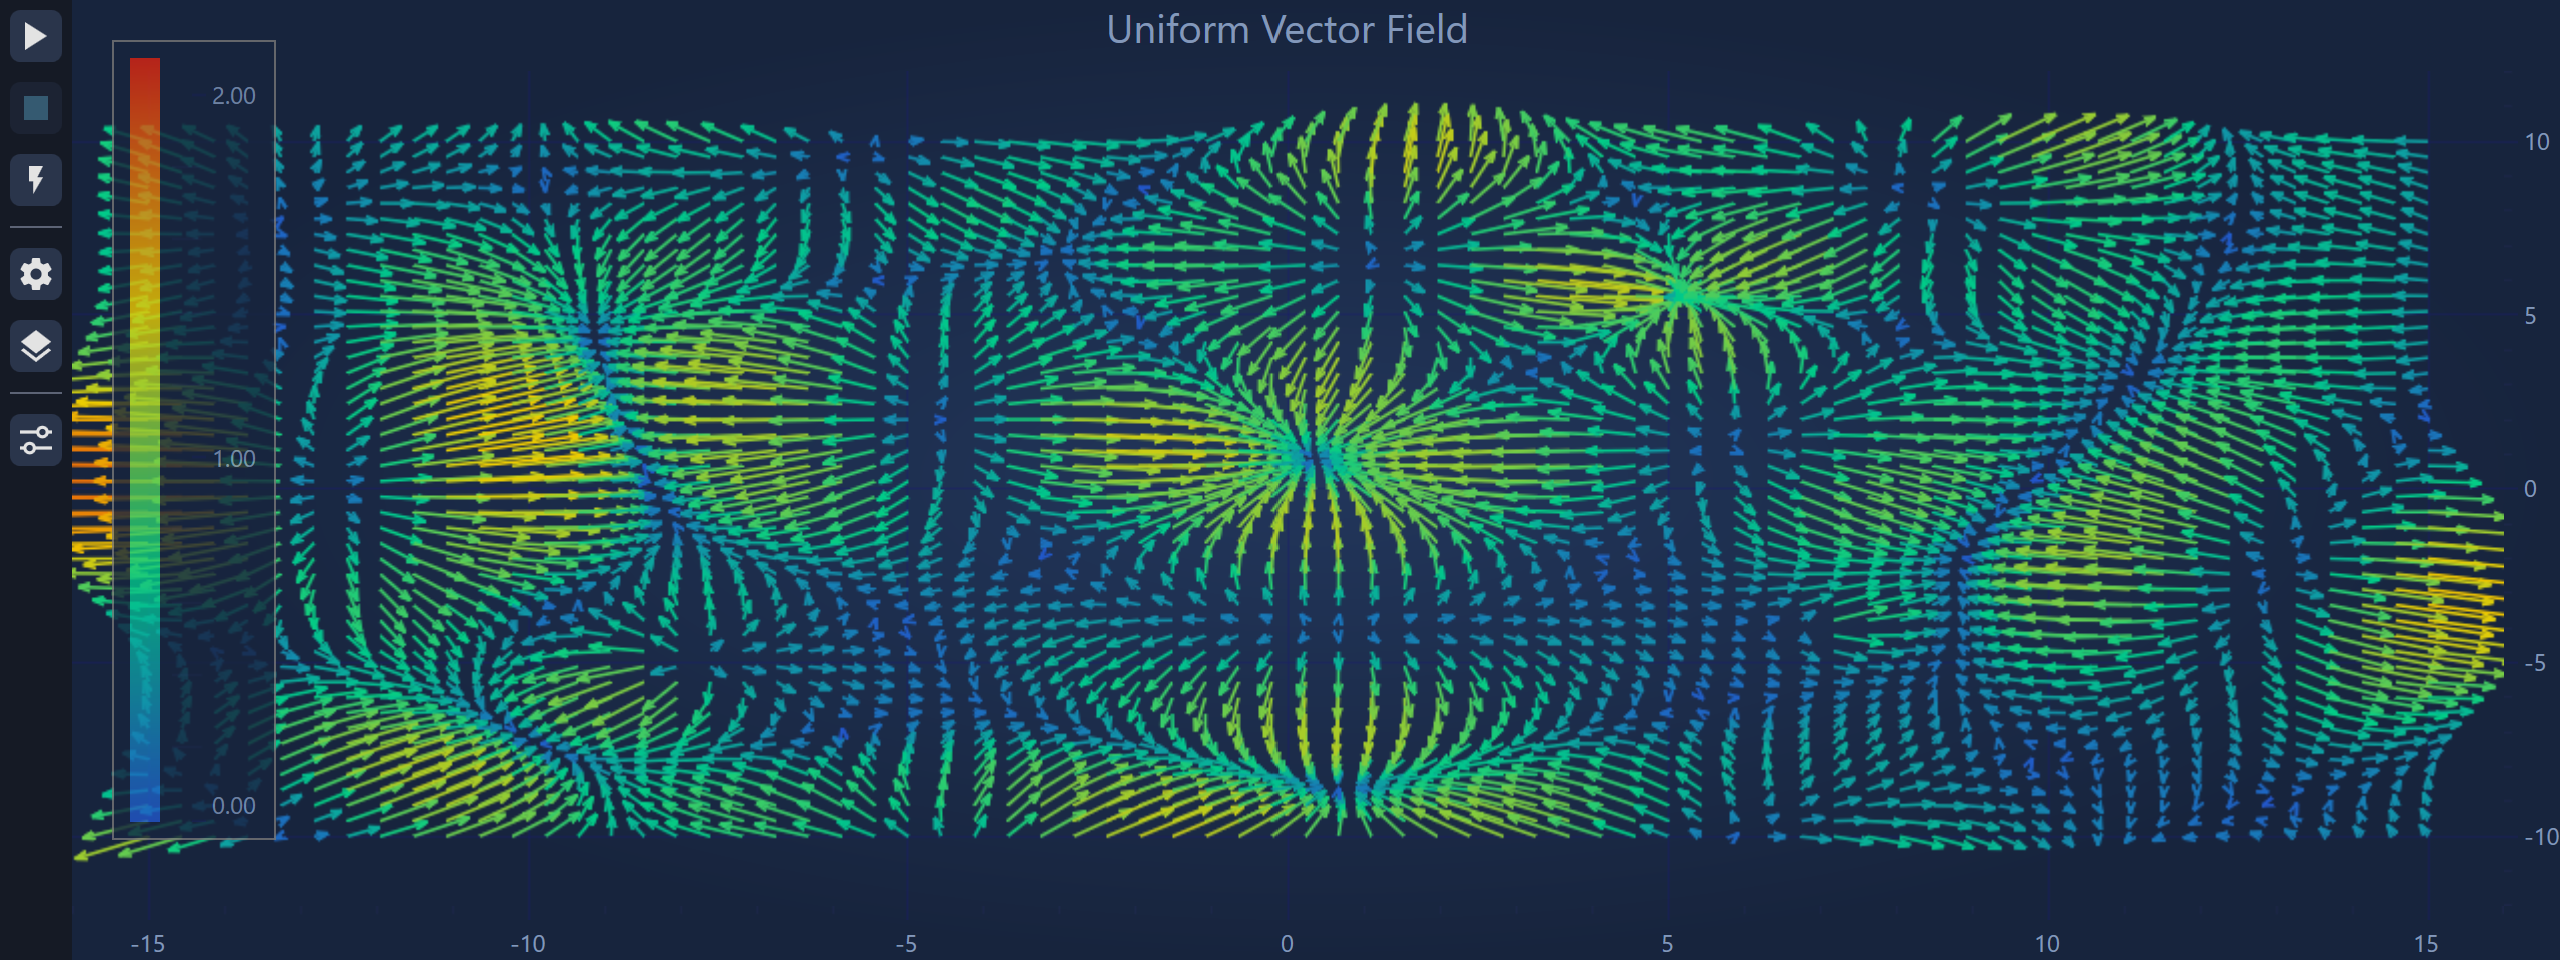
UniformVectorFieldDataSeries
Use UniformVectorFieldDataSeries when vectors lie on a regular X × Y grid.
Instead of specifying coordinates explicitly, you define:
- grid origin
- grid spacing
- displacement arrays
Example:
| Creating UniformVectorFieldDataSeries |
Copy Code |
|---|---|
// 70 × 46 grid spanning X=[-15,15], Y=[-10,10] double xStep = 30.0 / 69; double yStep = 20.0 / 45; var dxs = new double[70, 46]; var dys = new double[70, 46]; // populate dxs and dys... var ds = new UniformVectorFieldDataSeries( xMin: -15, xStep: xStep, yMin: -10, yStep: yStep, dxs: dxs, dys: dys); VectorSeries.DataSeries = ds; | |
An optional IPointMetadata[,] array can be supplied to attach metadata to each vector.

NonUniformVectorFieldDataSeries
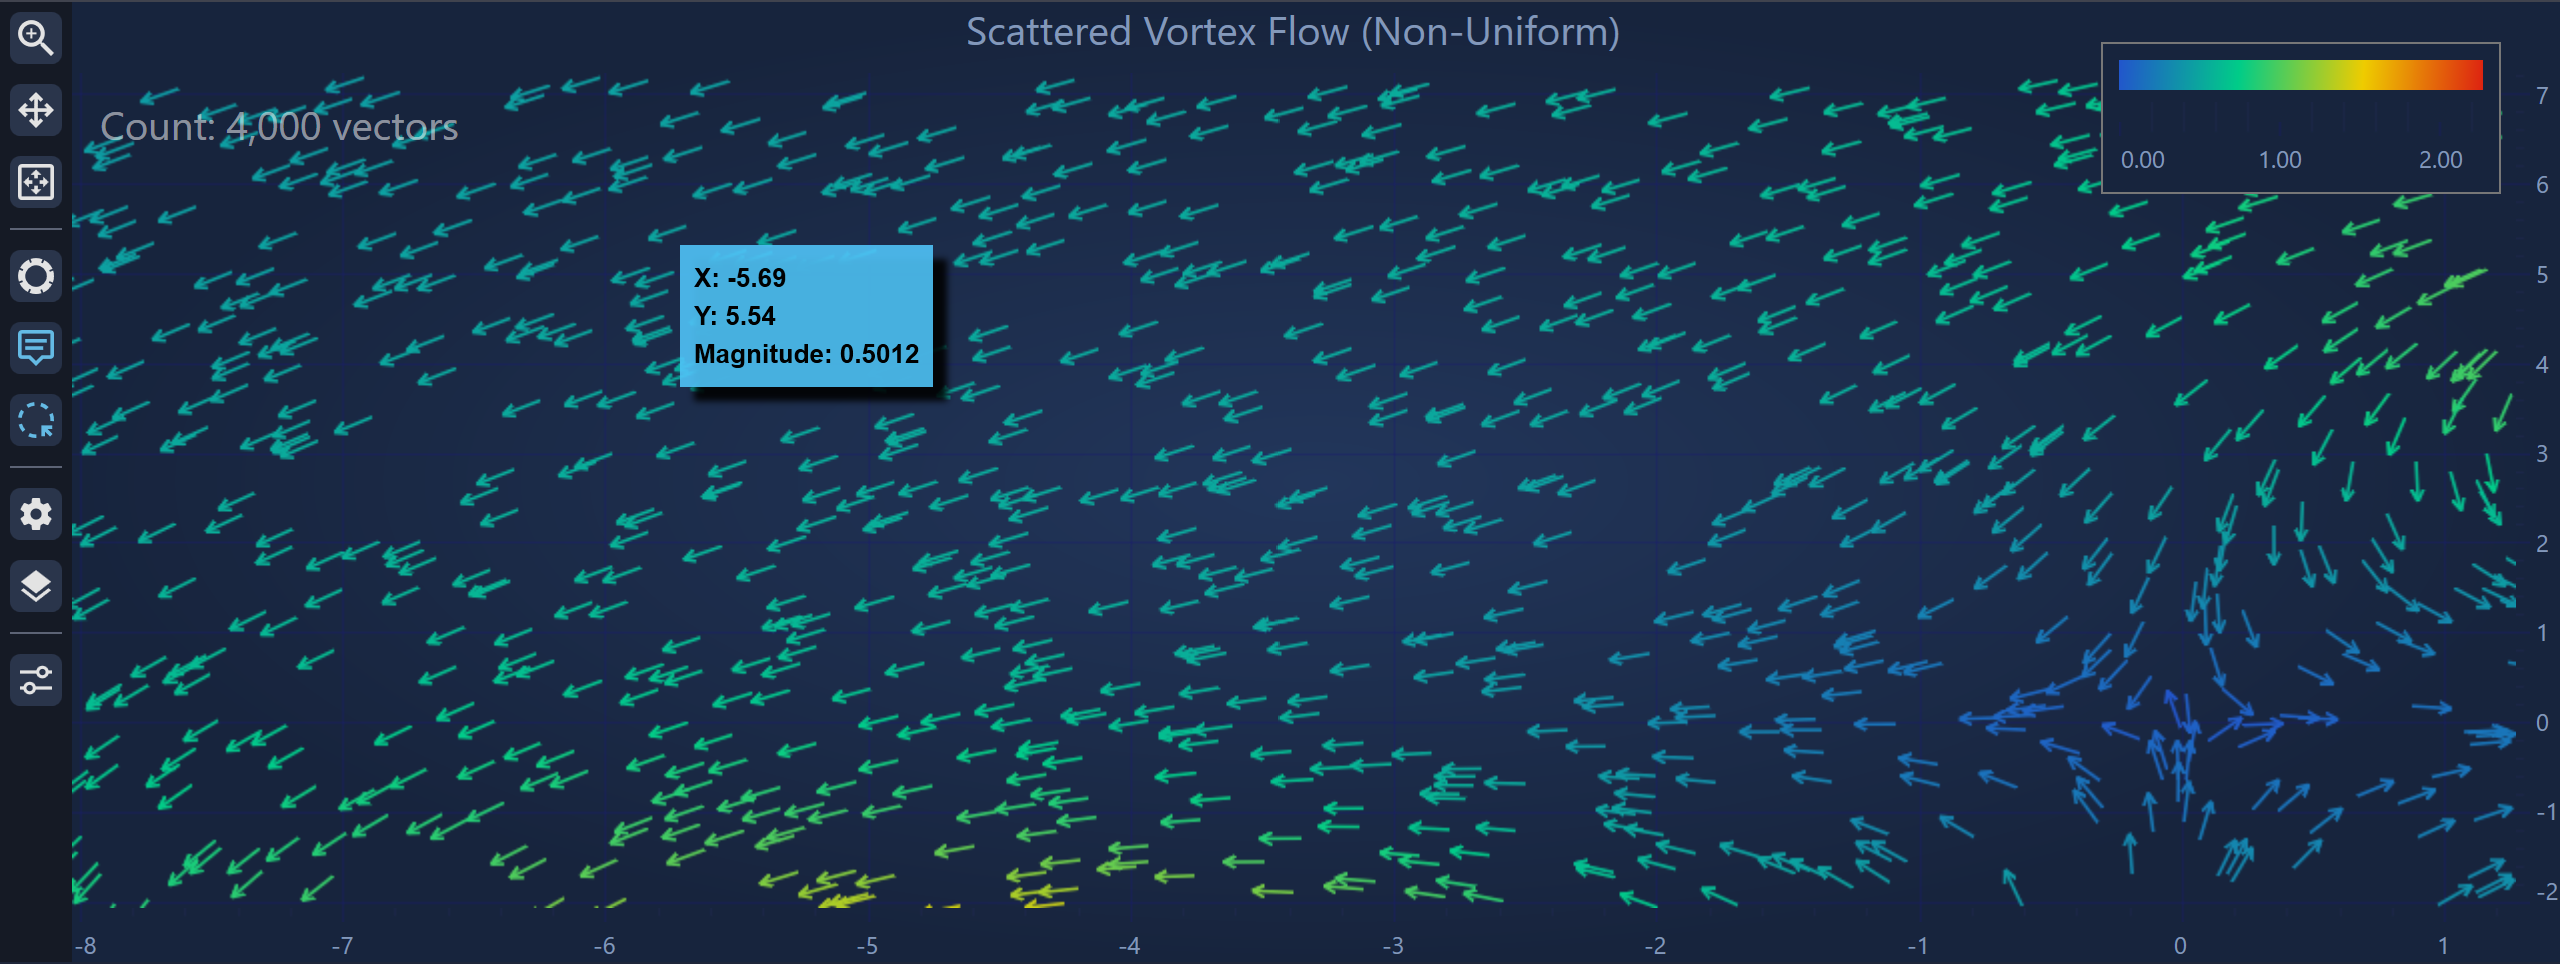
Use NonUniformVectorFieldDataSeries when vectors are positioned at arbitrary coordinates.
You provide four parallel arrays containing origins and vector components.
Example:
| Creating NonUniformVectorFieldDataSeries |
Copy Code |
|---|---|
var xs = new double[] { 1.0, 3.5, -2.0 }; var ys = new double[] { 0.5, 2.0, 4.0 }; var dxs = new double[] { 0.3, -0.1, 0.8 }; var dys = new double[] { 0.1, 0.5, 0.2 }; var ds = new NonUniformVectorFieldDataSeries(xs, ys, dxs, dys); VectorSeries.DataSeries = ds; | |
This format is useful when vector samples come from scattered measurements or irregular simulations. An optional IPointMetadata[] array can be supplied to attach metadata to each vector.

Minimal Example
The following example demonstrates a simple vector field configured in XAML.
| Configuring Vector Field in XAML |
Copy Code |
|---|---|
<s:SciChartSurface> <s:SciChartSurface.RenderableSeries> <s:VectorFieldRenderableSeries Stroke="#4FC3F7" StrokeThickness="1.5" LengthMode="MagnitudePixels" MagnitudeScale="20" ColorMode="ByMagnitude" ArrowHeadLength="6" ArrowHeadWidth="4" IsArrowHeadFilled="True"> <s:VectorFieldRenderableSeries.ColorMap> <s:HeatmapColorPalette Minimum="0" Maximum="5"> <GradientStop Color="#FF0D0887" Offset="0"/> <GradientStop Color="#FFCC4778" Offset="0.5"/> <GradientStop Color="#FFF0F921" Offset="1"/> </s:HeatmapColorPalette> </s:VectorFieldRenderableSeries.ColorMap> </s:VectorFieldRenderableSeries> </s:SciChartSurface.RenderableSeries> <s:SciChartSurface.XAxis> <s:NumericAxis VisibleRange="-15, 15"/> </s:SciChartSurface.XAxis> <s:SciChartSurface.YAxis> <s:NumericAxis VisibleRange="-10, 10"/> </s:SciChartSurface.YAxis> </s:SciChartSurface> | |
Configuring Vector Rendering
Arrow Geometry
Arrowheads can be customized using the following properties:
- ArrowHeadLength - defines the arrowhead length in pixels
- ArrowHeadWidth - defines the arrowhead width in pixels
- IsArrowHeadFilled - controls whether arrowheads are filled or outlined.
Filled arrowheads require additional drawing operations and are therefore slower. For high-performance scenarios, outline arrowheads are recommended.
Vector Length Modes
The LengthMode property determines how arrow length is calculated from (DX, DY).
DataUnits
The arrow tip is located at:
(X + DX, Y + DY)
This mode represents the true vector geometry in data space. Arrow lengths change when zooming.
MagnitudePixels
Arrow length is proportional to vector magnitude but expressed in screen pixels.
pixelLength = |v| × MagnitudeScale
This keeps arrow size stable during zooming while still representing magnitude.
FixedPixels
All arrows are drawn with a constant screen length, defined by PixelLength.
Vector direction remains correct, but magnitude is not encoded in arrow size.
The following two properties can modify vector length, depending on the LengthMode:
- MagnitudeScale - scale factor used in MagnitudePixels mode.
pixelLength = |v| × MagnitudeScale
- PixelLength - defines the constant arrow length used in FixedPixels mode.
Visibility Culling
Visibility culling skips vectors that would be visually insignificant or excessively large.
- MinVisibleLengthPx - vectors shorter than this screen length are skipped. Useful for suppressing near-zero vectors around singularities
- MaxVisibleLengthPx - vectors longer than this threshold are skipped. Useful for removing extreme outliers
Color Mapping
The ColorMode property determines how arrow colors are assigned:
- Solid - all arrows use the series Stroke color. This is the fastest rendering mode
- ByMagnitude - arrow color is determined by vector magnitude:
|v| = sqrt(DX² + DY²)
The value is mapped through the ColorMap color palette.
- ByDirection - arrow colour is determined by vector direction:
θ = atan2(DY, DX)
The direction angle is mapped to the ColorMap color palette.
Using a ColorMap
HeatmapColorPalette defines a color gradient used for magnitude or direction mapping.
Example:
| Defining HeatmapColorPalette |
Copy Code |
|---|---|
<s:HeatmapColorPalette Minimum="0" Maximum="5"> <GradientStop Color="#FF0D0887" Offset="0"/> <GradientStop Color="#FFCC4778" Offset="0.5"/> <GradientStop Color="#FFF0F921" Offset="1"/> </s:HeatmapColorPalette> | |
Values outside the defined range are clamped to the specified Minimum and Maximum.
Adding a Color Legend
A vector field can be accompanied by a visual colour legend using the HeatmapColorMap control.
| Adding HeatmapColorMap |
Copy Code |
|---|---|
<s:HeatmapColorMap ColorMap="{Binding ElementName=VectorSeries, Path=ColorMap.GradientStops, Converter={StaticResource GradientStopsToLinearGradientBrushConverter}}" Minimum="{Binding ElementName=VectorSeries, Path=ColorMap.Minimum}" Maximum="{Binding ElementName=VectorSeries, Path=ColorMap.Maximum}" Orientation="Vertical" Height="300"/> | |
LOD (Level-of-Detail) Rendering
For dense vector fields, LOD rendering reduces the number of vectors drawn on screen.
- CullingCellSizePx - divides the viewport into square cells. Only the highest-magnitude vectors in each cell are rendered. This dramatically reduces draw calls for dense datasets.
- MaxVectorsPerLodCell - controls how many vectors may be rendered per LOD cell, defined by CullingCellSizePx. This is useful to visualize denser field regions when LOD culling is enabled.
Realtime Updates
Vector fields support efficient real-time updates by modifying the underlying data arrays directly.
Step 1 – Retain Array References
Keep references to the data arrays that are passed into a DataSeries:
| Data Array Referencing |
Copy Code |
|---|---|
private double[,] _dXs; private double[,] _dYs; .. UniformVectorFieldDataSeries _dataSeries = new UniformVectorFieldDataSeries(xMin, xStep, yMin, yStep, _dXs, _dYs); | |
Step 2 – Update Arrays on a Background Thread
| Background Array Update |
Copy Code |
|---|---|
private bool _newDataReady; private Timer _updateTimer; _updateTimer = new Timer(OnUpdateTimer, null, 0, 20); ... private void OnUpdateTimer(object state) { for (int xi = 0; xi < ds.XCount; xi++) for (int yi = 0; yi < ds.YCount; yi++) { // Update the retained data arrays _dXs[xi, yi] = newXValue; _dYs[xi, yi] = newYValue; } } // All writes complete - signal the rendering handler that fresh data is available _newDataReady = true; } | |
Step 3 – Trigger Rendering
Only invalidate the chart when new data is available:
| Triggering Rendering |
Copy Code |
|---|---|
CompositionTarget.Rendering += OnRenderingTick;
...
        private void OnRenderingTick(object sender, EventArgs e)
        {
                if (!_newDataReady) return;
                _newDataReady = false;
                _dataSeries?.InvalidateParentSurface(RangeMode.None, DistributionArgs, true);
} | |
Providing FieldDataDistributionArgs
Providing distribution arguments avoids a full data scan every frame.
| Providing FieldDataDistributionArgs |
Copy Code |
|---|---|
private static readonly FieldDataDistributionArgs DistributionArgs = new FieldDataDistributionArgs { XRange = new DoubleRange(xMin - maxMag, xMax + maxMag), YRange = new DoubleRange(yMin - maxMag, yMax + maxMag), MagnitudeRange = new DoubleRange(0, maxMag), IsStationary = false }; ... _dataSeries.InvalidateParentSurface(RangeMode.None, DistributionArgs, hasDataChanges: true); | |
This removes an O(n) range calculation step during rendering.

Performance Guidelines
For best performance, apply these optimizations together:
- Provide FieldDataDistributionArgs to avoid expensive range scans each frame
- Use outline arrowheads by setting IsArrowHeadFilled = false
- Use Solid color mode when possible to avoid per-arrow palette lookups
- Enable LOD culling to reduce field density. Typical values CullingCellSizePx = 8 to 16px
- Suppress tiny vectors by setting MinVisibleLengthPx = 1 to 2px
- Update data off the UI thread. Perform calculations on a background thread and signal the UI thread only when needed
- Reuse the same DataSeries instance. Updating arrays in place avoids memory allocations and pipeline resets
Tooltips and Hit Testing
VectorFieldRenderableSeries integrates with TooltipModifier to inspect individual vectors.
The tooltip data context is VectorFieldSeriesInfo:
Custom Tooltip Template
| Creating Tooltip Template |
Copy Code |
|---|---|
<DataTemplate DataType="chartData:VectorFieldSeriesInfo"> <StackPanel Margin="5"> <TextBlock Text="{Binding SeriesName}" FontWeight="Bold"/> <TextBlock Text="{Binding FormattedXValue, StringFormat='X: {0}'}"/> <TextBlock Text="{Binding FormattedYValue, StringFormat='Y: {0}'}"/> <TextBlock Text="{Binding FormattedZValue, StringFormat='|v|: {0}'}"/> </StackPanel> </DataTemplate> | |
Apply it to the series:
| Applying Tooltip Template |
Copy Code |
|---|---|
<s:VectorFieldRenderableSeries s:TooltipModifier.TooltipTemplate="{StaticResource MyVectorTooltip}" /> | |